The Event-based Experiment
The event-based experiment measures statistical deviations associated with global events and combines these into a cumulative, or aggregate, result. Here we present the basic parameters and define some terminology. First, we look at a summary presentation of the results accumulated over six years of formally defined events.
Protocol
The experimental protocol is based on a two part procedure: A. identify a global event, and B. specify a statistical measure to be calculated. This constitutes an event prediction. Predictions may proposed to the project director by GCP collaborators or other interested persons. Accepted predictions are entered into a formal prediction registry before data is accessed from the database archive.
Event selection
The following paragraph provides useful background, but the event selection procedure has become more standardized in recent years. Details for several kinds of events are described under event specifications.
In keeping with the exploratory nature of the experiment, there is not a unique criterion for accepting proposals as global events. Event selection is subjective and is guided by experience and consultation. Most events are considered global because they involve the attention or activity of many people around the world and figure prominently in news reports. Thus, a local event such as a natural disaster can be considered global if it gains global attention. Other criteria are used. A few astrological events are accepted because of their non-local (therefore, global) character. Certain prayers and meditations that involve relatively modest numbers of people are accepted because there is a global intention such as world peace. A look at the experimental result as a function of event category is presented in the analysis section. It is not a contradiction to maintain that the experiment is both open-ended and rigorous, but it is important to state where the rigor lies. Once a prediction is made, the analysis is rigorous and unambiguous. Event selection, prediction determination and the ongoing nature of the experiment are not rigorous in this sense. Thus, the experiment should not be viewed as constructing a hypothesis test against a significance level, as is done for classical hypothesis testing. This does not, of course, rule out judging that the 4-sigma result is highly significant, which is a matter of assessment, and not a report of a test result. It is important to highlight this aspect of the experimental methodology. Since most events correspond to newsworthy happenings, the frequency of events over time varies. Nevertheless, the experiments adds a fairly regular number of events per year (about 25-30).
Predictions
An accepted prediction specifies an examination period for the data associated with the event, and a statistic to be calculated. The statistic is determined by a recipe which includes a blocking for the data. A weighting is determined for combining event statistics into the cumulative experimental result. Examination Periods The length of an examination period reflects a guess of the time duration for which an event will correlate with the data. Period lengths vary from 1 minute to many days. About 75% of the events have examination periods of 4 hours or less. Most predictions specify contiguous data blocks, but some multi-period events are accepted. An example is event 48 which selects an hour-long ceremony repeated 4 times during a single day. In order to assure statistical independence, examination periods may not overlap. If a long event overlaps a short one, the overlap period may be removed for the long event and assigned to the short one. This creates a multi-period event we call a fractioned event. Details of the distribution of examination periods are given in the tables and figure below.
| GCP Events: Aug. 4, 1998 - Sept. 8, 2004 | |
|---|---|
| Shortest event | 1 minute |
| Longest event | 9.27 days |
| Average event length (170) | 8.4 hrs |
| Median event length (170) | 2.5 hrs |
| Average event length < 1 day (156) | 2.8 hrs |
| Median event length <1 day (156) | 2 hrs |
| Multi-period events | 15 |
| Fractioned events | 3 |
| Period Length | Number of Events | Period Length | Number of Events |
|---|---|---|---|
| 1 minutes | 2 | 4.15 hours | 1 |
| 4.8 | 1 | 4.17 | 1 |
| 5 | 2 | 4.63 | 1 |
| 6 | 1 | 5 | 4 |
| 10 | 13** | 6 | 3 |
| 15 | 6 | 7 | 2 |
| 20 | 3 | 8 | 5 |
| 24 | 1 | 10 | 2 |
| 25 | 2 | 10.75 | 1 |
| 30 | 12 | 11.5 | 1 |
| 35 | 1 | 12 | 1 |
| 40 | 2 | 13 | 1 |
| 45 | 1 | 16 | 1 |
| 60 (1 hour) | 15 | 16.47 | 1 |
| 62 | 2 | 21 | 1 |
| 65 | 1 | 23 | 1 |
| 1.5 hours | 1 | 23.5 | 1 |
| 1.8 | 2 | 24 | 9 |
| 2 | 12 | 4 days | 1 |
| 2.17 | 1 | 4.49 | 1 |
| 2.5 | 1 | 6 | 1 |
| 3 | 18 | 8.5 | 1 |
| 4 | 27 | 9.27 | 1 |
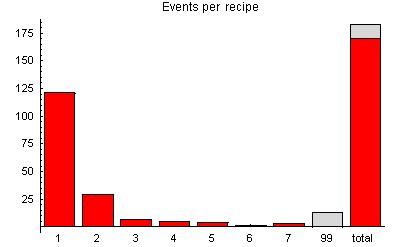
Recipes
The formal events are listed in a computer readable version of the prediction registry. As mentioned earlier, there are several different specific analysis recipes that stipulate how an event statistic is calculated. The recipe first specifies a block statistic within the blocked examination period and then how these are combined to give an event statistic. The 7 recipes are listed below. Some (rejected) events have undetermined or ambiguous recipes. These are grouped as recipe #99.
-
Standard analysis
- Blocking: all regs at one second resolution
- Blocking statistic: S = Stouffer Z of reg z-scores
- Event statistic: Sum S² as chisqr
-
Reg blocking
- Blocking: block regs individually at R-second resolution
- Blocking statistic: S = Stouffer Z of reg z-scores
- Event statistic: Sum S² as chisqr
-
New Years Meanshift
- Blocking: all regs at one second resolution across 37 timezones
- Blocking statistic: S = Stouffer Z of reg z-scores
- Event statistic: Sum S² as chisqr
-
New Years Variance
- Blocking: one data block across 10-minute periods for 37 timezones
- Blocking statistic: S = Var(z)
- Event statistic: -S as chisqr
-
Network blocking
- Blocking: block data across all regs at R-second resolution
- Blocking statistic: S = Stouffer Z of reg z-scores
- Event statistic: Sum S² as chisqr
-
Directed difference
- Blocking: one data block across 37 timezones
- Blocking statistic: S = Stouffer Z of reg z-scores
- Event statistic: XXX
-
Superposed periods
- Blocking: all regs at one second resolution across T periods
- Blocking statistic: S = Stouffer Z of reg z-scores
- Event statistic: Sum S² as chisqr
Recipe #99: A total of 13 events that were originally in the formal series have been excluded because they were partially redundant or overlapped others, or were not unambiguously defined in the original narative predictions.
Blocking
An examination period consists of an array of trial z-scores by ndexed reg IDs and the time in seconds. The array is divided into data blocks according to the prediction specifications. Blockings used in the formal event analyses are shown in the figure below. A statistic is calculated for each data block (labelled B
in the figure). Blockings that include all reporting regs are termed network blocking (orange, cyan, and blue in the figure). Blockings that contain only one reg are termed reg blocking (green). The time dimension of a block is the blocking resolution. Thus, the orange blocking is network blocking at one second.
About 75% of the events use this blocking scheme. Blockings which take the whole examination period as a single block are event blocking and those containing a subset of regs are termed group blocking.
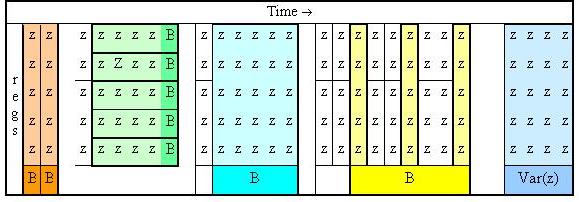
zrepresents the standardized score for a trial (one reg, one second), and each
Brepresents a statistic computed for a block of devices or times or combinations.
Weighting in analysis recipes (placeholder)
Assessing the Effect of Blocking
The earliest analysis method was a hand calculation using 15-minute blocking of the data. In this method the composite Z for each egg is computed for each time block in the event. The sum of the resulting Z values is a Chisquare with degrees of freedom equal to the number of blocks times eggs. The early procedure was replaced for most events by a standard analysis
using the raw data with no blocking. But an obvious question was what effect the various blocking levels might have on the outcome. One form of the question is, What is the optimum blocking level?
Here we begin to look at this question in a rigorous and comprehensive way.
