| Current Results | |
|
Turkey Earthquake
This is the comprehensive set of graphical analyses complementing and extending
the primary results for the earthquake on the 17th of August, at 03:02, near Istanbul, Turkey.
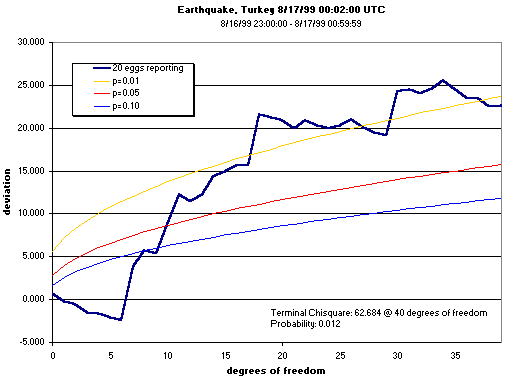
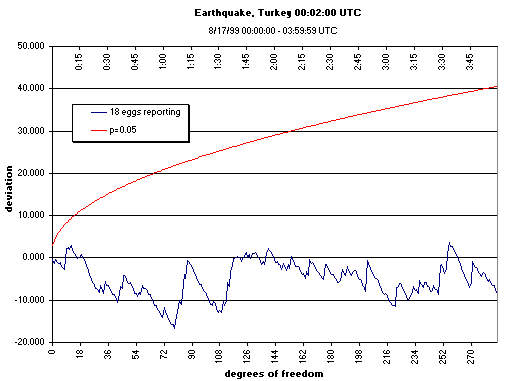
Two GCP predictions were made, one for a half-hour block centered on the quake, the second
for a four-hour aftermath period. The following figures show the results as displayed in
George deBeaumont independently confirmed the analyses shown in the primary Turkish Earthquake page. His figures show the half-hour block, the four-hour aftermath, a 2-hour block centered on the quake, and another four hour period beginning four hours after the quake. The block-size is 15 minutes in all cases. The first analysis confirms the RDN analysis for the half-hour centered on the quake.
The second analysis confirms the RDN analysis for the 4-hour aftermath, with slightly shifted vertical axis due to more complete dataset.
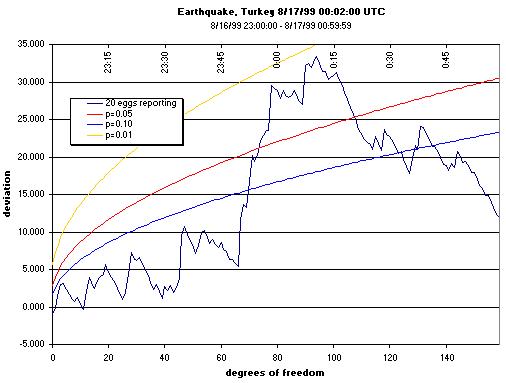
The next few figures are also shown on the main page, but are retained here for completeness. DeBeaumont's third analysis examines the quake-centered period from one hour before to one hour after the main tremor.
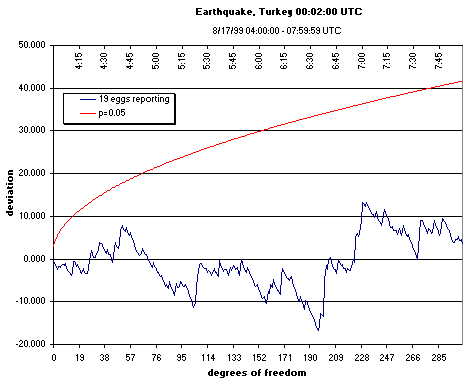
The fourth analysis extends the aftermath period to 4 to 8 hours post-quake.
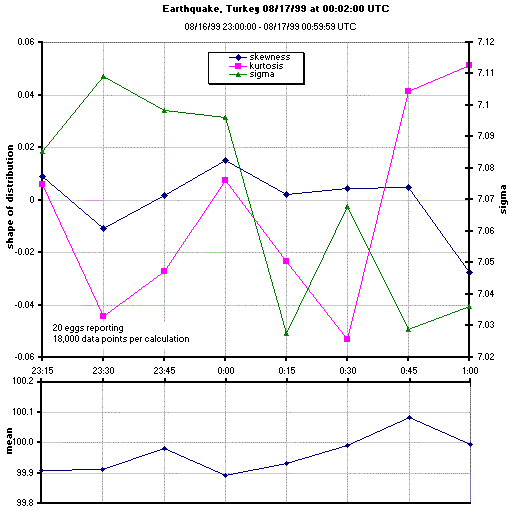
George computed the statistical parameters for the two-hour period surrounding the quake, and displayed them in the following figure.
Dick Bierman looked at the event from another perspective, collapsing all egg data within the 15-minute blocks to a single point, and then plotting the odds against chance for the deviations. His analyses cover a longer time-period, from two hours before to two hours after the earthquake. The first analysis shows the data for all eggs reporting at the time.
The second analysis examines the differences, and similarities, between the results for all eggs in Europe versus those in the US, over the same period of time.
Taking a longer view, Bierman extracted 32 hours of data surrounding the quake, from which he generated the following two figures. The first shows the absolute deviation from MCE (=100) cumulated over the 32 hours and averaged (smoothed) with a one hour sliding timewindow. The second shows the cumulative deviation from the expected variance (for 10 minute epochs), smoothed with a 2 hour window. This graph shows a huge increase in variance around the earthquake. But before jumping to conclusions, Dick suggests, we must see a much larger timeframe. (See also Ed May's assessment of random data, below.)
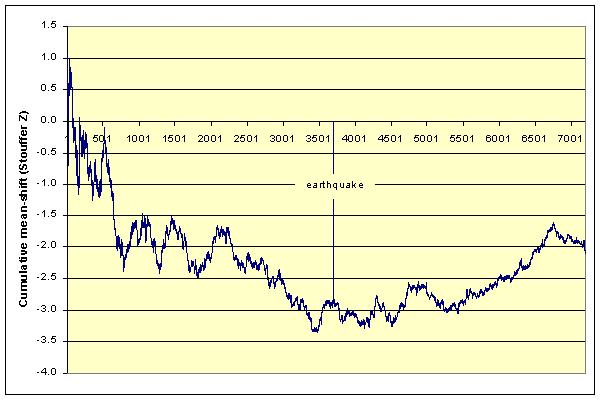
There are many methods for visualizing data, each of which provides some insight. Dean Radin first plotted the data surrounding the earthquake as a cumulative Z-score over the two-hour period. The blocking unit (probably) is the raw, second-by-second trial values. The second figure shows the odds ratio (1/p) for the same data. In both graphs, the vertical line shows the time of the quake. In his a third analysis, the cumulative difference from expected variance is shown, based on the raw egg data (i.e, not scrambled eggs). Dean's description: The expected variance for samples of 200 bits is 50. I calc the variance per set of 20 eggs, per second. Let's call this value "var." This should be about 50. I then take the cumulative sum of (var- 50) starting an hour before the earthquake to an hour after and plot it. The graph shows (as expected of course given the other analyses) that the raw egg variance is larger than expected before the earthquake, and smaller than expected starting about 5 minutes before the quake to an hour afterwards.
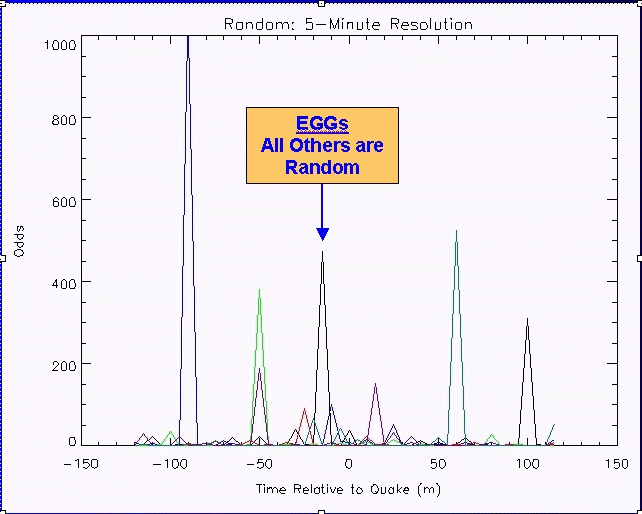
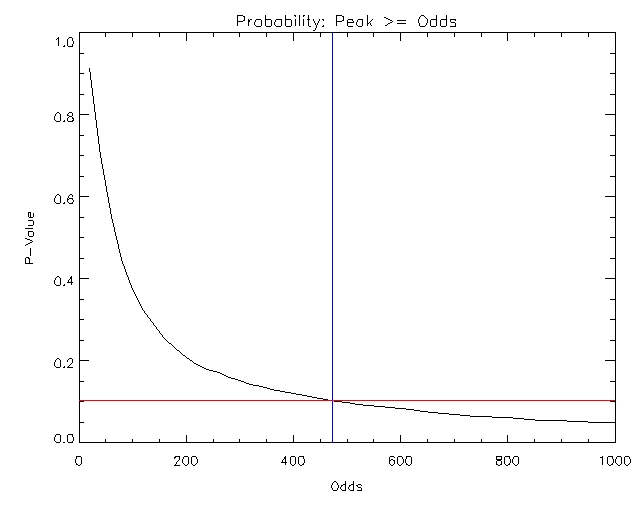
Ed May asked the question whether random data might show peaks like those apparently associated with the Turkey earthquake. He sent the following figure to show what he sees as "a major problem with the data concerning the Turkish earth quake. The black and labeled curve is the 5-minute EGG data that replicates what Dick had done. "The other curves are the next 5 [sets of] random generated data. Perhaps synchronicity, but that is what happened. I ran another 5 with only one with a peak above 100. I did not plot them because it gets messy. "For me, if the EGG results are anything at all, it is likely to be experimenter effect." To examine the matter more thoroughly, Ed subsequently ran 5000 Monte Carlo passes to estimate the probability of a peak like that which occured at the time of the earthquake in the Bierman analysis, which had odds of 473. In a 4-hour period, with 20 eggs, using 5-minute blocks, the chance probability of a block with (1-p)/p > 473 is 0.10. This is linearly scalable across the total time examined, so in a half hour period the probability is 0.0125. This is strikingly similar to the calculated probability (0.012) for the formal prediction concerning the half-hour surrounding the earthquake, even though the specification for it was analysis in 15-minute blocks. The second figure, below, shows the distribution of the Monte Carlo results, with a vertical line marking the position of the actual data in the distribution.
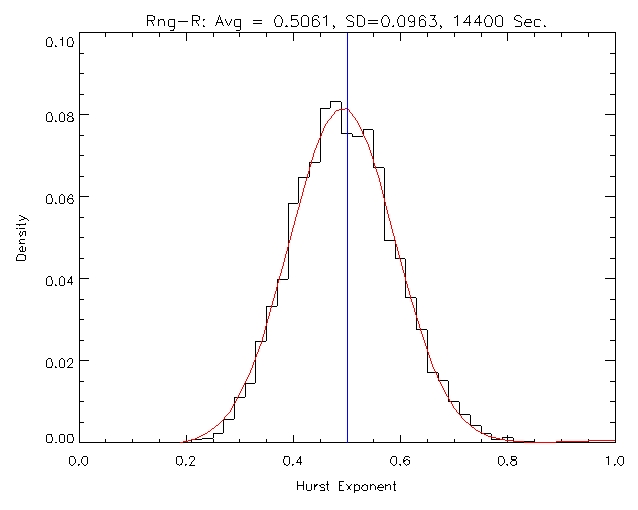
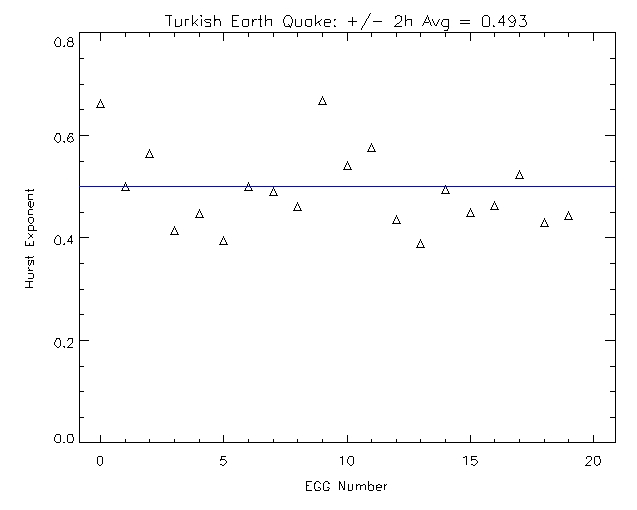
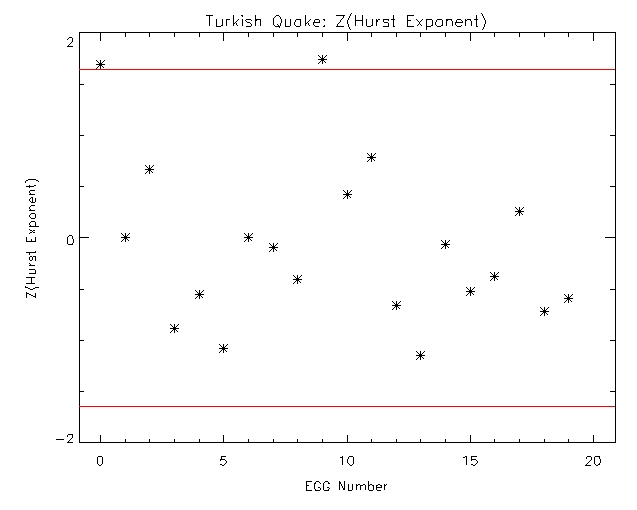
Together with James Spottiswoode, Ed also looked at the Hurst coefficient in the GCP data for the 2-hour period around the quake. This coefficient has an expectation of 0.50 in random data, and higher values indicate "persistence" which implies non-independence of the data elements. The Hurst coefficient (or exponent), is considered to be a sensitive measure of memory in the data stream. The following figures show the results, beginning with a distribution of the Hurst Exponent based on 5000 Monte Carlo runs, then plots of the raw and Z-score equivalents Hurst exponents as a function of Egg number. These results indicate that the EGG data are indistinguishable from chance using this measure.
| |
