| Current Results | |
|
Turkey Earthquake
On the 17th of August, at 03:02, near Istanbul, Turkey, a large earthquake occurred, measuring
approximately 7.8 on Richter
scale. Early reports indicated devastating destruction of homes, and as many as 1000 people
killed. Subsequent reports gave the death toll as 3800, with many thousands injured, and
later, over 7000 dead and 35000 missing and feared dead, a terrible catastrophe.
Ultimately more than 15000 died.
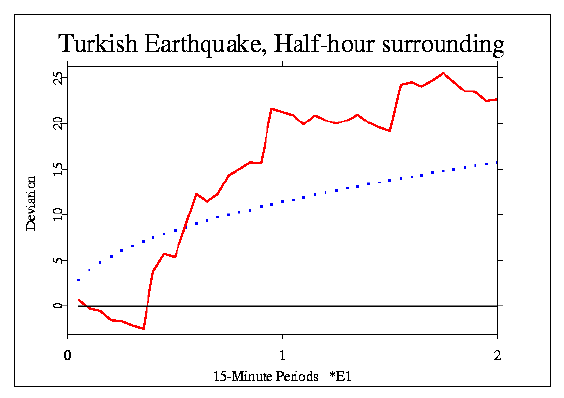
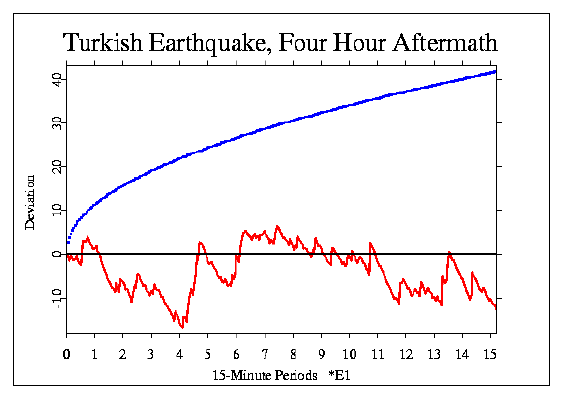
Two GCP predictions were made, one for a half-hour block centered on the quake, the second for a
four-hour aftermath period. The following figures show the results. Chisquare was 62.684 with 40 df
and p = 0.012 for the half hour period. The second analysis is preliminary (missing value problems),
but has approximate Chisquare 291.6 on 304 df, p = 0.685.
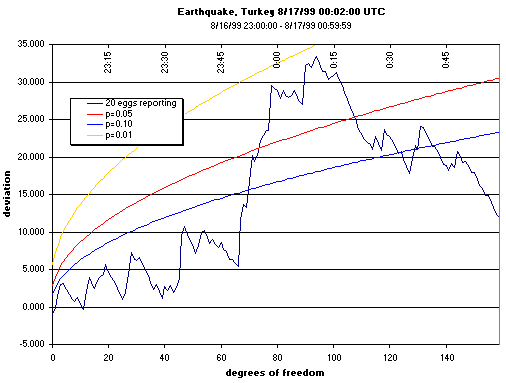
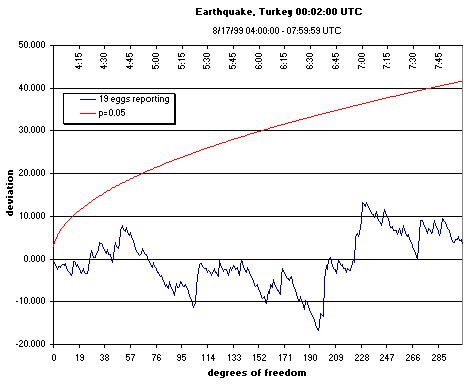
George deBeaumont explored further, and independently confirmed the first analyses. His figures, which are part of a large, comprehensive set of graphical explorations by several analysts, duplicate the results for the half-hour block and the four-hour aftermath, and go on to explore context. These analyses show results for a 2-hour block centered on the quake and another four hour period beginning four hours after the quake. The block-size is 15 minutes in all cases. The analysis of data in the quake-centered period one hour before to one hour after:
The analysis of the aftermath period from 4 to 8 hours post-quake:
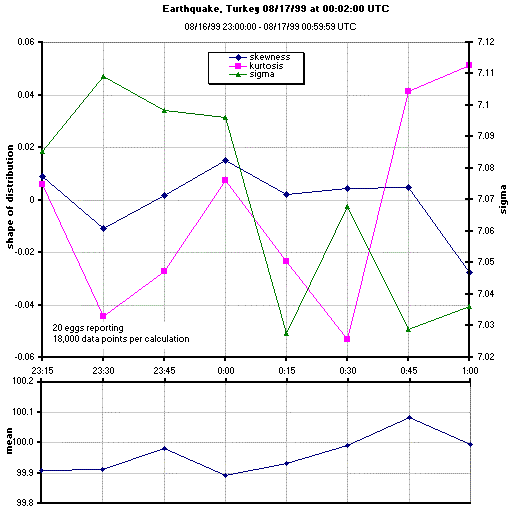
George computed the statistical parameters for the two-hour period surrounding the quake, and displayed them in the following figure.
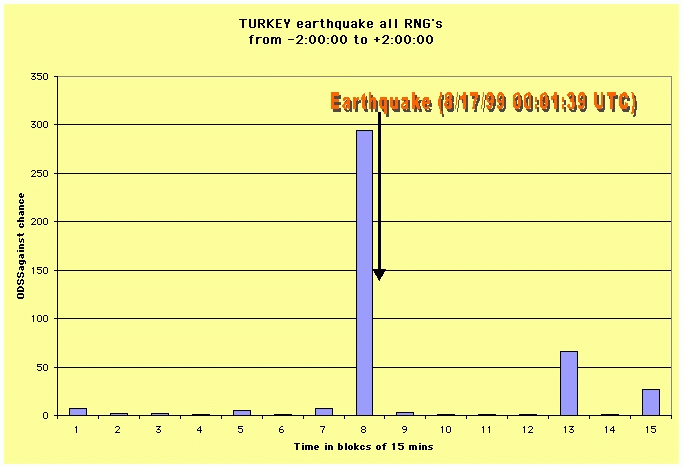
Dick Bierman looked at the event from another perspective, collapsing all egg data within the 15-minute blocks to a single point, and then plotting the odds against chance for the deviations. His analyses cover a longer time-period, from two hours before to two hours after the earthquake. The first analysis shows the data for all eggs reporting at the time.
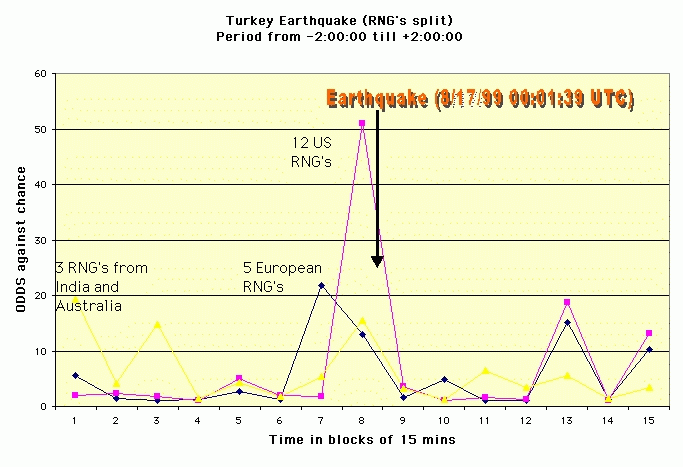
The second analysis examines the differences, and similarities, between the results for all eggs in Europe versus those in the US, over the same period of time.
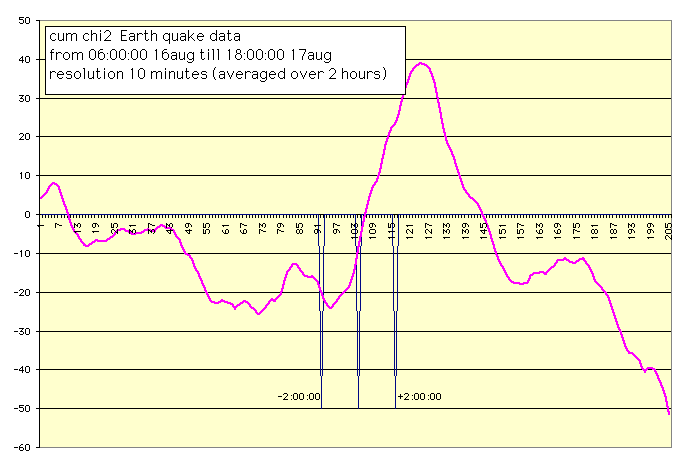
Taking a longer view, Bierman extracted 32 hours of data surrounding the quake, from which he generated the following figure showing the cumulative deviation from the expected variance (for 10 minute epochs), smoothed with a 2 hour window. This graph shows a huge increase in variance around the earthquake. But before drawing conclusions, Dick suggests, we must examine a much larger timeframe.
There are many methods for visualizing data, each of which provides some insight. Several more analyses of the Turkish earthquake data are shown in a comprehensive set of graphs, which require substantial download time. They include work by Dean Radin, Dick Bierman, James Spottiswoode, and Ed May, and provide useful perspectives for those interested in greater detail and insight.
| |