Results for Y2K, New Year, 1999 to 2000

The transition to the year 2000 was a major event all around the world, and, of course a major event for the Global Consciousness Project. Here we present the primary results for the formal predictions. A large number of subsidiary and exploratory analyses have been performed to examine the data taken around the time of the New Year transition, and these are available for study in the First Results page and via other links. Please note that some of the following are preliminary results, pending still more cross-checking.


Formal prediction, RDN, analysis by George deBeaumont

Based on the significant results shown during the New Year transition 1998 to 1999, a similar prediction was made that the Y2K data would show unusual structure around midnight, specifically in the period midnight ± 5 minutes, across all eggs and all time zones. The prediction specified that the raw second-by-second data would be used, and that the measure would be the composite Chisquare representing the total deviation from expectation across all data for the 10-minute period.

On Saturday, 1 Jan 2000, George deBeaumont sent the first-cut analyses of the set of 21 eggs which had reported as of that date. Seven had not yet reported, but do have data. When these data have been processed together with the original batch, this analysis will be updated. Table 1 lists the eggs ordered by longitude (one egg, in Richmond CA, is not included in the table). The subsequent figures show the cumulative deviation of Chisquare (Z²) from theoretical expectation versus the time in seconds (or degrees of freedom). This is a measure of the degree to which the output of the REG devices departs from the expected mean for the trial values recorded each second. If there is no anomalous change in the mean outcome, the resulting cumulative deviation trace should resemble a random walk around zero deviation. If some persistent anomalous effect is present, the trace will show a consistent trend, which may culminate in a statistically significant departure, as indicated by the parabolas in the figures. The tables and figures were created by George deBeaumont. Interpretive remarks are by Roger Nelson, whom you may contact if you have questions.

Table 1: Descriptive Information, All Eggs as of 2000-01-01

Table 1: Y2K, EGG table

Examples: Suva, Fiji; Auckland, New Zealand, 111

The cumulative deviation of Chisquare (technically, Chisquare - df) is shown in this figure, to give some feeling for the nature of the data compounded in the analysis. The two random walk traces here represent the data from two eggs as they responded during the Y2K rollover. The figure shows for context a full hour of data, more than is specified in the formal prediction. The trends in the data traces during the specified 10 minutes can be seen in the segments between 1500 and 2100 seconds; the Suva trace in that period shows a positive trend, but the Auckland trace appears to be essentially level around midnight.

Suva, Fiji, 100 and
Auckland, NZ, 111

For a detailed look at all the individual traces, click here.

By 2 January, 22 eggs had reported data. The 22 cumulative deviation lines are superimposed in the next figure. Note that the scale is changed to show only the 10 minutes surrounding midnight. Although there are some fairly striking deviations, the general impression is that the many traces tend to balance each other so that there is a similar weight of deviation in positive and negative directions.

All Eggs as of 2 January, 2000

All Eggs, January 2

One of the assumptions made for the sake of hypothesis generation for the GCP is that the effects are spatially non-local, and under this assumption, each egg is affected by co-temporaneous events, no matter where they take place on the earth. Thus, at midnight in any given time zone, we hypothesize that the effects of the conscious engagement of everyone celebrating there will be felt by all eggs in the GCP network. An hour later, when the celebration reaches the next time zone, there will again be a global effect, impinging on all of the GCP recording devices.

Final Synchronized Deviation of Chisquare, Midnight ± 5 Min, Y2K

The intended analysis for this prediction requires the use of data from all eggs and all timezones. Data were recorded from 28 eggs across the 24-hour period of celebration around the world. Following George's precedent for the JAM analysis, all 36 zones with integer or half-hour differences from GMT were used for the following figure. In contrast to the 22 egg, 10 timezone analysis, the deviation is clearly positive, though not significant, with a Chisquare of 624.412 on 600 degrees of freedom, and an associated p-value of 0.237. This analysis is considered formal, but it has not yet been independently cross-checked (March 10).

Synchronized sum of
22 eggs


Independent Formal prediction, DIR: Smoothed Variance Data

Dean Radin takes a different approach to the data, based on the idea that an increased coherence will be present in the data, generated in response to the coherent interactions of large numbers of people celebrating the Y2K transition together. This conception leads to a prediction that the spread, or variance of the REG data should be decreased around the moment of greatest engagement. The obvious prediction is for that moment to be just at midnight, with a buildup before and some lingering period of continuing celebration after. The analysis procedure uses a measure of the variance across all eggs, averaged across time zones, and smoothed with a 5-minute wide sliding window.

The first version of the analysis was reported on the 2nd of January, but we determined that a conceptual error made that analysis centric to the GMT (UTC) time zone, and although the result showed a striking spike at midnight, it was not properly representative of the original prediction.

A corrected analysis addressing the intended question was completed on 23 January, using a kurtosis measure, but it has been redone subsequently with a simpler procedure using variance. The latter analysis is presented in the following figure. As explained in the detailed description, this analysis uses a non-standard, exploratory approach, but it has been thoroughly cross-checked, primarily using a permutation analysis, where the data are scrambled and the same analysis performed repeatedly, in this case 2000 times. This provides a background against which the actual data can be compared, and the Z-score combining the extreme minimum value of the variance with the minimum time separation from midnight is -3.662, a value that corresponds to a probability against chance of 0.000125. (A larger permutation base of 10000 runs gives an even larger combined extreme value of Z = -3.85, with a corresponding probability of p = 0.00006.)

Ed May and James Spottiswoode have provided independent oversight and cross-checks. Their calculations give similar results, but they do not concur with the interpretations because the strong result is critically dependent on choice of analysis parameters. In particular, whereas Dean Radin originally specified 24 integer timezones, Ed and James argue that there are large populations in some of the half-hour and 45-minute offset timezones. When the full array of analyses is available they will be added to the exploratory Y2K analysis pages. In the meantime, I have also developed some independent analyses or tests within Dean's conceptual framework. One of these is presented below, and the others are described in the Y2K exploration pages.

Given that Dean's analysis procedure was not completly pre-specified, but was developed by trying several approaches, his calculated probability needs to be adjusted to compensate fairly for the multiple opportunities for a good result and the selection of the best of several outcomes. Dean reports that he tried about 10 different analyses looking for ways to optimize a spike at the moment of interest (i.e., a deviation that peaks near midnight). The appropriate Bonferroni correction, multiplying the probability by a factor of 10, still leaves an impressively small probability, on the order of 1 in 1000, for the highly focused minimum at midnight for the Y2K transition to have occurred by chance.

The analysis results in a graph of the average deviation of normalized, superposed, epoch variances. The figure speaks for itself, strongly suggesting that something special did occur in the GCP data around midnight. The detailed description of the steps in Dean's original analysis is interesting and informative. The combined deviation drops precipitously as midnight approaches, and reaches its extreme minimum at three seconds before midnight, the moment of transition.

Deviation of normalized variance, GCP Data, Y2K
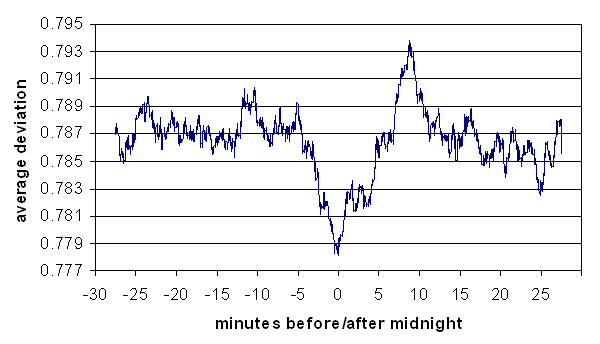
Z-score, Average Deviation of eggs at Y2K

This striking figure indicates a sharply focused effect just at midnight, as predicted. The following graph displays changes in the deviation of the mean trial value across eggs over the time surrounding the Y2K transition. The cumulative sum of the median of the squared deviation of the mean from its empirical expectation is plotted, revealing a striking spike at midnight.
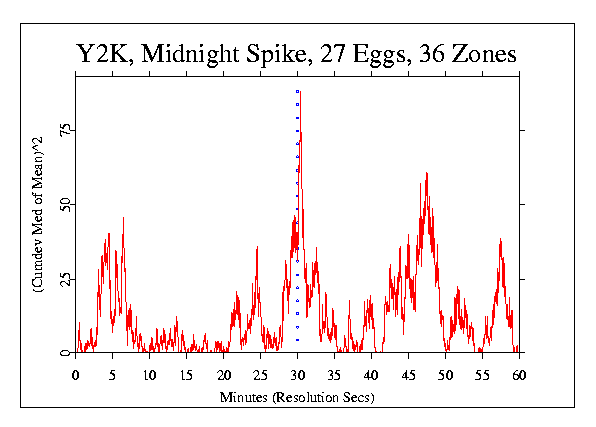
Cum Squared Median of Mean

Interpreted literally, this suggests a brief but very sharp increase in the absolute deviations of trial outcomes just at the moment of greatest engagement in the New Year's celebration. A permutation analysis shows that the maximum deviation is not extremely rare, with a greater value appearing somewhere in 90.3% of the permuted datasets. The placement of the spike so close to midnight (it maximizes at 24 seconds after) is, however, quite unlikely; a 4000-permutation analysis yields a p-value of 0.022 of a spike occuring this close or closer to midnight. The combined probability of a spike this large and this close is p = 0.020, suggesting that we might expect to find such impressive structure merely by chance only twice in 100 repetitions of the Y2K experiment.

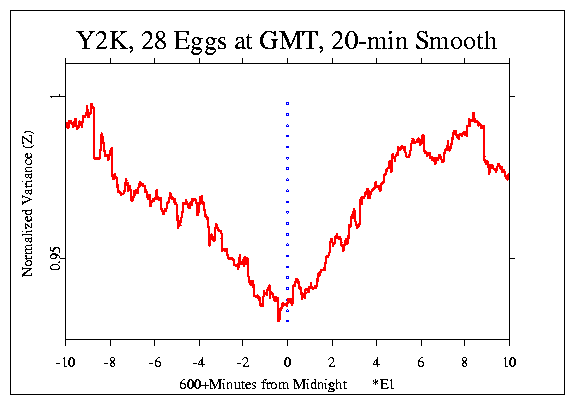
Notes added in November 2000: I had thought about the first, remarkable spike figure that Dean produced, which he said was wrong because it focused on midnight, GMT only. In an effort to understand this better, I concluded that there might have been a cumsum involved, which under certain conditions, can lead to a spike roughly in the middle of a dataset. I explored simpler ways of looking at the variance, concentrating on the GMT focus, and found many indicators of a special time near midnight. The following figures show the normalized variance (the deviation from expectation expressed as a Z-score) for the two hours surrounding midnight, and a 20 minute detail. The data are smoothed with a 20 minute running mean window.
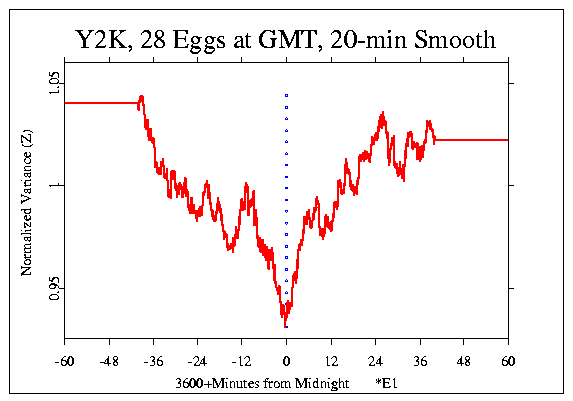
Normalized Variance
Normalized Variance

Afterword, on interpretation, RDN

These results, and some others in the GCP database, have generated considerable commentary, and among the "alternative" explanations which are offered is the suggestion that it may all be an "experimenter effect." This is not meant as a suggestion that there is anything wrong with the machines, or the protocols, but as an interpretation that the source of the effect is not some sort of global consciousness, but the intentions, the consciousness of the experimenters. I mentioned this concern to a sage I know and she said, "So what? We can all be experimenters."

That made me laugh, for it does so succinctly put the point that a real effect in this stuff is meaningful, even if it doesn't mean what we might have wished, or what we imagined we could show.


Return to top

GCP Home