School Slaughter in Pakistan
Standard analysis
At least 141 people, including 132 children, have been killed in an attack by Pakistani Taliban fighters (TTP) on a military-run school in Peshawar in Pakistan's northwest. Explosions and gunfire rang out as seven armed men with suicide vests attacked the Army Public School on Tuesday morning, in one the bloodiest attacks in Pakistan's history. Ten staff members were also killed. Officials told Al Jazeera that all seven attackers were killed in the operation.
The timeline of the attack speaks to the dimensions of the tragedy:
05:30 GMT - Attack began
when a group of seven attackers, reportedly in military uniforms,
entered the school
07:11 GMT: TTP claims
responsibility. The gunmen were reportedly under orders to shoot older
students
07:25 GMT - Evacuation of children and teachers begins with a rescue
process underway.Nearby schools start closing down
10:47 GMT - Reports say
as many as 10 loud explosions heard at the school. Reporters say the
operation underway is reaching a climax
12:35 GMT - Eleven more teachers rescued from the school
13:14 GMT - Another injured child succumbs to his wounds at Leady
Reading Hospital in Peshawar, raising the death toll to 131
14:12 GMT - Last gunman killed. Operation over
Al Jazeera's Kamal Hyder, reporting from Peshawar, said: "Most of the younger pupils escaped the school, but the senior students were not so lucky."
Specific hypothesis and results
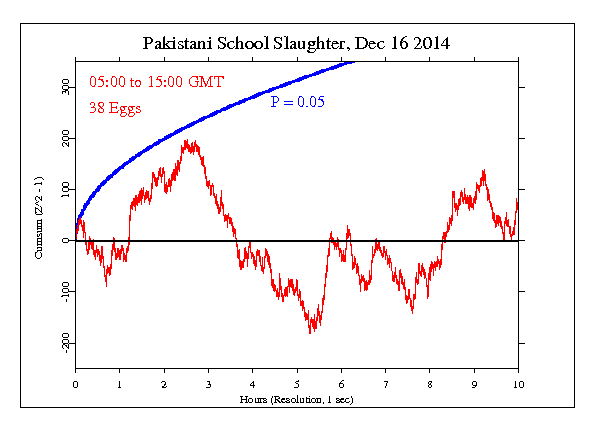
The GCP hypothesis was set for 10 hours beginning just before the attack at 05:00 GMT, ending at 15:00. The result is Chisquare 36070 on 36000 df for p = 0.396 and Z = 0.263.
Interpretation
The following graph is a visual display of the statistical result. It shows the second-by-second accumulation of small deviations of the data from what's expected. Our prediction is that deviations will tend to be positive, and if this is so, the jagged line will tend to go upward. If the endpoint is positive, this is evidence for the general hypothesis and adds to the bottome line. If the endpoint is outside the smooth curve showing 0.05 probability, the deviation is nominally significant. If the trend of the cumulative deviation is downward, this is evidence against the hypothesis, and is subtracted from the bottom line. For more detail on how to interpret the results, see The science and related pages, as well as the standard caveat below.

Standard caveat
It is important to keep in mind that we have only a tiny statistical effect, so that it is always hard to distinguish signal from noise. This means that every “success” might be largely driven by chance, and every “null” might include a real signal overwhelmed by noise. In the long run, a real effect can be identified only by patiently accumulating replications of similar analyses.
