Protests Against Trump's Muslim Ban
Washington (CNN)
President Donald Trump signed an executive order Friday that indefinitely suspends admissions for Syrian refugees and limits the flow of other refugees into the United States by instituting what the President has called "extreme vetting" of immigrants.
Titled "Protection Of The Nation From Foreign Terrorist Entry Into The United States," the executive order would start to make good on Trump's promise to tighten borders and halt certain refugees from entering the United States.
The text of the order -- in a break from drafts that had been circulating earlier this week -- drops a longtime Trump campaign pledge to establish safe zones in Syria to give Syrian nationals displaced by the ongoing civil war in the country a place to relocate.
The order bars all persons from certain terror-prone countries from entering the United States for 90 days and suspends the US Refugee Admissions Program for 120 days until it is reinstated "only for nationals of countries for whom" members of Trump's Cabinet deem can be properly vetted.
On Sunday, huge protests began building up against what is happening to travelers coming into the US. "People are being pulled off planes and pushed into detention centers in airports across the US today -- legal visa holders, visitors, refugees, even the green card holding spouses of American citizens!" (Avaaz) Once again the world is seeing the dark side of our politics, and watching in fear of what this portends.
Specific Hypothesis and Results
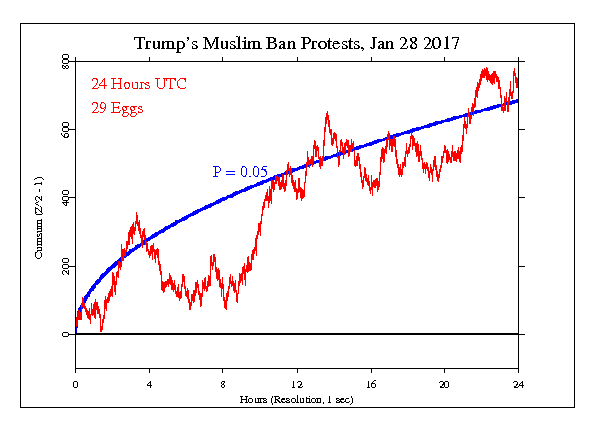
The GCP event was set as the 24 hour day of January 28, UTC, which includes most of the huge buildup of protests at JFK and SFO, Dulles, O'hare and many other airports. The result is Chisquare 87108 on 86400 df, for p = 0.045 and Z = 1.699.
Interpretation
The following graph is a visual display of the statistical result. It shows the second-by-second accumulation of small deviations of the data from what’s expected. Our prediction is that deviations will tend to be positive, and if this is so, the jagged line will tend to go upward. If the endpoint is positive, this is evidence for the general hypothesis and adds to the bottom line. If the endpoint is outside the smooth curve showing 0.05 probability, the deviation is nominally significant. If the trend of the cumulative deviation is downward, this is evidence against the hypothesis, and is subtracted from the bottom line. For more detail on how to interpret the results, see The Science and related pages, as well as the standard caveat below.

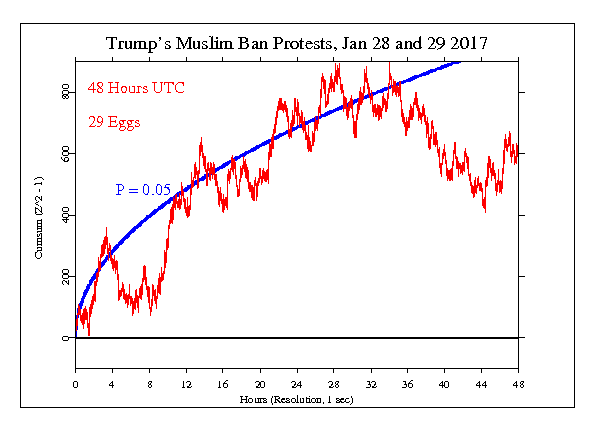
A correspondent asked what the data looked like during the continuing demonstrations. The formal event definition was for only the 24 hours of the 28th, but it is possible to do an exploratory look to answer the question. In the figure below we see that the original trend continues for another 10 or 12 hours and then reverts to a jaggy, but basically level, random trend.

Standard caveat
It is important to keep in mind that we have only a tiny statistical effect, so that it is always hard to distinguish signal from noise. This means that every success
might be largely driven by chance, and every null
might include a real signal overwhelmed by noise. In the long run, a real effect can be identified only by patiently accumulating replications of similar analyses.
