RESULTS
Data were recorded from two random event generator
(REG or RNG) systems in Amsterdam by Dick Bierman and one in Utrecht by
Dick Bierman and Rens Wezelman. Emil Boller and Holger Boesch ran two
systems in Freiburg. Richard Broughton ran two systems in Durham. Joop
Houtkooper ran one system in Giessen and Paul Stevens ran one in
Edinburgh. Roger Nelson ran five systems in Princeton. The available
data are thus from 14 independent REG systems in seven different
locations, all in the US or Europe.
All the random sources included in this study are used
in professional research applications, and are qualified as nominal
random sources. In previous work (Nelson,
1997; Nelson, et al, 1997) resampling techniques have
shown that non-active (control) data surrounding those identified as the
experimental segments, conform to theoretical expectations. Hence, the
comparisons here are with theoretical expectation rather than with
arbitrary control data. Several different data formats were used, and
the distribution parameters had to be inferred from the data in some
cases, but since the raw data closely approximate random variates in all
cases, these inferences are appropriate. For example, in his typical
applications, Bierman constructs a Chisquare by summing Z2
for arbitrarily defined sub-segments that are about 4.3 seconds long,
rather than taking experimentally defined segments as the unit of
measure. Since the pre-stated protocol specified that the measure would
be the unsigned meanshift of the data taken during the time of the
meditation, the appropriate analysis required a calculation of this
value from the raw data provided by each of the labs. The formal
experimental hypothesis was that the segment means would show larger
deviations than expected by chance, i. e., that the segment variance
would be increased. This hypothesis was tested by normalizing the
meanshifts as Z-scores and summing the squared Z-scores to yield a
Chisquare distributed quantity with degrees of freedom equal to the
number of segments. The following table shows the normalized deviation
of the mean for each segment, and the corresponding Chisquare (1 df) and
probability, with the experimenter and the location also indicated:
Global
Meditation Results by Location:
Z-Scores, Chisquares, and
Probabilities |
Experimenter | Place | Z-score | Chisquare | DF | p-value
|
|---|
| JH |
Giessen |
0.776 |
0.602 |
1 |
.438 |
| PS |
Edinburgh |
2.81 |
7.930 |
1 |
.005 |
| RB-1 |
Durham |
0.925 |
0.856 |
1 |
.355 |
| RB-2 |
Durham |
0.100 |
0.010 |
1 |
.920 |
| EB-1 |
Freiburg |
1.382 |
1.910 |
1 |
.167 |
| EB-2 |
Freiburg |
0.137 |
0.019 |
1 |
.890 |
| DB-1 |
Amsterdam |
-1.785 |
3.187 |
1 |
.074 |
| DB-2 |
Amsterdam |
-0.135 |
0.018 |
1 |
.893 |
| DB-3 |
Utrecht |
0.950 |
0.903 |
1 |
.342 |
| RN-1 |
Princeton |
1.267 |
1.604 |
1 |
.205 |
| RN-2 |
Princeton |
-1.677 |
2.812 |
1 |
.094 |
| RN-3 |
Princeton |
1.476 |
2.178 |
1 |
.140 |
| RN-4 |
Princeton |
0.740 |
0.546 |
1 |
.460 |
| RN-5 |
Princeton |
-1.144 |
1.308 |
1 |
.253 |
|
| All
Data |
|
1.984 |
23.883 |
14 |
.047 |
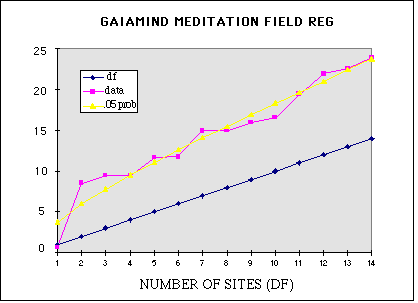
The same data can also be displayed graphically, as a
cumulative Chisquare over the 14 independent recordings, which allows
the relative sizes of the separate contributions to be visualized. Since
the data were taken concurrently, the order in which they are displayed
is arbitrary; of course, the final value of the accumulated deviation is
not affected by the order. The figure also includes the expectation
(df), which in this case is also the number of segments,
and an
envelope showing the locus of the 5% probability for so large a
Chisquare as the number of samples increases. The last line in the
table, and the last point on the graph both show the result when the
data are concatenated across the 14 different devices. This overall
accumulation represents a result that falls in the range considered
significant by most scientists. It would occur by chance less than 5
times in 100 repetitions of the full experiment, and it supports the
pre-stated hypothesis that the output of the various random event
generators would deviate from expectation during the time of the global
meditation.

