|
From the International Herald Tribune:
PHILADELPHIA: For a quarter of a century, it was an
agonizing cycle for Philadelphia sports fans. Hope, despair,
bitterness. For 9,282 days, other places had earned the
right to raise banners and hoist trophies. No U.S. city with
so many teams had failed for so long.
Now it is over. Now it is Philadelphia's turn. A game that
began with a deluge has washed away an epic drought. The
Philadelphia Phillies have won the World Series.
They did it in Game 5 on Wednesday, edging the Tampa Bay
Rays, 4-3, in the completion of the first suspended game in
postseason history.
It began on Monday, and rain and snow delayed it another
day. For the chronically heartbroken, it was a catharsis
worth the wait.
The GCP assessment was stimulated by Brenda Dunne's suggestion:
Have you looked at the data from the World Series game in
Philadelphia last
night? (It was a short game, only 3 and 1/2 innings,
starting at 8:30pm and
ending at around 10.) As you know, I'm not a big sports
fan, but there was
something magical about this event. The team's evident
resonance, among
themselves and with the fans, was powerful and strongly
contagious, even on
the TV. The excitement that followed, which seemed to
involve the entire
city of Philadelphia in a state of ecstasy, was also quite
extraordinary.
See what the machines have to say!
We have a number of sporting events in the formal series, including some
World Cup Soccer matches and previous World Series. For the
GCP event in this case
I added, as usual, some time before and
after the nominal event, specifying 8 to 10:30pm local time.
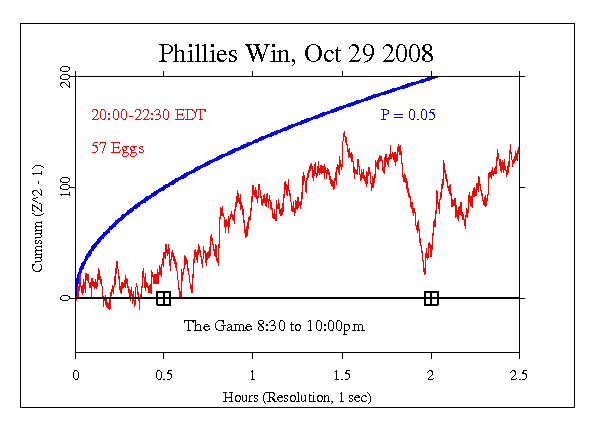
The result is an interesting graph with a steady positive
slope though it's not significant. But at the end of the game
there is a whopping downward spike for a few minutes.
While acknowledging that interpretations of single events
and graphs are unreliable, this is a really striking, unusual
feature in my experience.
In any case, the outcome is Chisquare 9139.4 on 9000 df for
p = 0.149 and Z = 1.039. For an interesting extension, see
the next graph.

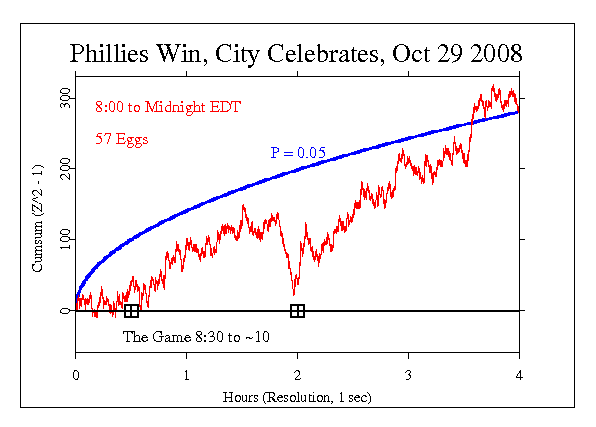
The following figure explores a longer aftermath, responding to
Brenda's remark about
the excitement that followed the game. She said it seemed to
involve the entire
city of Philadelphia in a state of ecstasy, and was quite
extraordinary. This segment shows a steeper positive slope from the
time the game ended until midnight, and by itself
shows what would be a significant deviation if this had been
our formal prediction.

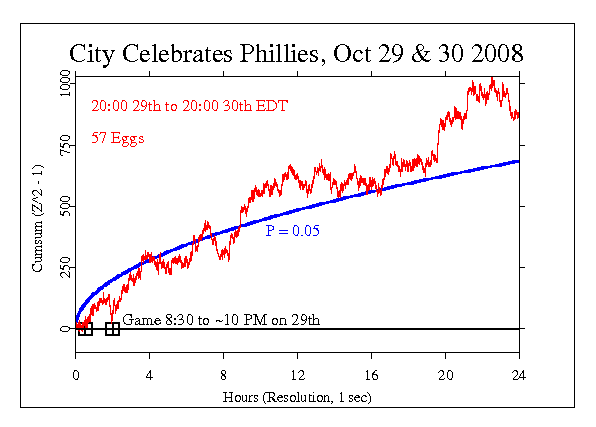
Extending the time still further, we include the continuing
celebration through most of the next day in the following figure.
The strong trend continues. Of course there are other things going on
that are engaging people in wider circles around the world.
Not least among these is the excitement of the election two
days from now. So we can't ascribe the deviations from
randomness in these figures only to the joy and celebration
of the Phillies World Series win, but it is fair to suggest
these emotions make a contribution.

It is important to keep in mind that we have only a tiny
statistical
effect, so that it is always hard to distinguish signal from
noise. This means that every "success" might be largely
driven by chance, and every "null" might include a real
signal overwhelmed by noise. In the long run, a real effect
can
be identified only by patiently accumulating replications of
similar analyses.
|