Elections 2000

This page has descriptions of three formal predictions and a number of contextual explorations. It begins with the prediction made prior to the election, and continues with additional noteworthy events in what ultimately was a 35-day wait for finality in the election.


Too Close to Call

The US Presidential Election, November 7 2000, was almost unique in US History because the final count of electors remained undecided three days after the voting. The first projection of a winner was made at 02:17 Eastern time (07:17 UTC) on November 8th. Not much later, this projection was withdrawn. On November 10th, the crucial Florida popular vote is being recounted, and is still "too close to call." The GCP prediction was, however, cast in terms of the earliest projection of a winner. From the prediction registry:

Prediction for the US presidential election, Nov 7 2000. Paul Bethke suggests that even though this is a US local event, there is understandable world-wide interest and attention. The election is predicted to be close, with polls showing a 2 or 3 percentage point advantage for Bush over Gore. After some discussion of a reasonable approach, Paul suggested that

... we set a data collection/observation time period of one
hour before to 3 hours after the first definite "projection"
of a winner. This [should identify the time of greatest
engagement and attention. We also should note] the time of the
losing candidate's "concession" call/speech. We can use CNN as
the official news media driving the clock. 

... The thrust of the prediction would be to observe the data
at and around the time when most people would be impacted by
the election results. A side experiment may be to see if there
are times of coherency throughout the voting day, or maybe a
buildup as time approaches result announcement. 

The formal prediction will be for a departure from expectation in the raw, trial-level data during the four hour period beginning one hour before CNN's first definite projection of a winner, and continuing for three hours after this time. Medium expectation (based on the US-centric nature of the event). Some explorations will be undertaken to see, for example, whether the US eggs will differentially respond. We will also examine the data during the losing candidate's concession call or speech, and In addition, we will take an exploratory look at the whole of election day, noting the time polls open on the east coast and finally close on the west coast.

The results for the predicted span of four hours are shown in the following graph, with the full network of 32 eggs in red, and the 13 US eggs shown in green. The time of the "first definitive projection" is marked. The formal prediction (all eggs) has a Chisquare of 14250, with 14400 degrees of freedom and a p-value of 0.811. Elections 2000, Early Returns

For context, the following figure shows the GCP data for almost three days, beginning with the polls opening at 09:00 EST on the 7th, and continuing to 19:00 EST on the 10th of November. The hash marks indicate the following moments:

  1. 9:00 am EST, 7 Nov, polls open
  2. 9:00 pm EST, 7 Nov, polls close
  3. 9:58 pm EST, 7 Nov, early projection Florida for Gore changes to "too close to call"
  4. 2:17 am EST, 8 Nov, First definitive projection, Bush wins (detail around this point shown above)
  5. 3:00 am EST, 8 Nov, Gore calls Bush to concede
  6. 4:00 am EST, 8 Nov, Gore retracts concession because Florida reverts to "too close to call"

As the following figure shows, there is not much to distinguish the GCP data taken during this period from a random walk. There is a striking trend down and up again early on the day of the elections, but it occurs long before the time for outcomes to be evident.

Elections 2000, 7th - 10th

On November 26, the Florida vote was certified by the Attorney General, apparently giving Bush the election, but this was contested further. We made no formal prediction, but for context the following figure shows the time around the certification announcement.

Elections 2000, Nov 26
court decision


The Florida Supreme Court on Recounting

Here are some more snaps of periods during the month-long and still (Dec 8 2000) continuing wait for a final decision in the Presidential election. Paul and I agreed to set a formal prediction for the 5-minute period when the Florida Supreme Court announced its decision on recounts. Gore apparently won a round at last, when the Florida Court held for his position, reversing a lower court decision, and ordered an immediate recount of undercounted counties. The announcement was at 4 pm Florida time, which was 21:00 UTC. A formal prediction was made that the 5-minute period from 4:00 to 4:05 would yield a noteworthy deviation. The Chisquare is 305.81 on 300 df, for a probability of 0.39631. The next figure shows this moment.

Elections 2000, Dec
08, 5 minutes

The very beginning of this period has a sharp rise for a few seconds, and a bit less than two minutes later there is another even more striking accumulation of extreme deviations. Paul also suggested looking at the two-hour period following the announcement: "Maybe include 2 hours after as the 'talk radio' hosts whip up emotions," and we agreed on this as a contextual exploration. The following figure shows that period, which begins with the data from the previous graph.

Elections 2000, Dec
08, hours

For context, the next figure shows the whole GMT day of Dec 8 2000, which corresponds to 19:00 on the 7th to 19:00 on the 8th in Florida. The announcement period is marked.

Elections 2000, Dec
08, All day, GMT


The Final Decision

On December 12th at about 10:00 pm, Florida time (EST), the US Supreme Court announced its decision to remand the last challenge case back to the Florida courts. Within a few minutes, the interpretations on the news programs began to make clear that Gore's chances were over, and Bush would be the winner. The data from the 30 reporting eggs were downloaded at exactly 10:15, for the purpose of the GCP analysis. The Chisquare for the 15 minute period is 981.06, on 900 degrees of freedom, with a corresponding p-value of 0.03062. The following figure shows this 15 minute period. It shows a strong deviation, which is unusual for political events. Perhaps it symbolizes the sigh of relief (which may have a flavor of resignation) that is surely a widely shared emotion. The formal prediction was again agreed to by Paul Bethke and Roger Nelson.

Elections 2000,
Dec 12, 22:00 to 22:15

Paul is developing an independent analytical approach which he has used for an exploration of the three hours of data surrounding this critical event. He says,"The data are from UTC 13-DEC-2000 02:00-05:00, the period around the publishing of the US Supreme Court decision which stopped the recounts in Florida. I believe the release was at or near 03:00. The peaks center around 03:50 - perhaps when it became clear what the ruling meant."

On the next day, Gore made his concession speech at 9:00 pm, EST, followed by Bush giving his acceptance speech at 10:00 pm. Though we made no formal prediction, expecting it to be somewhat anti-climactic, we thought that this final event in the long post-election saga deserved an exploratory look. Gore's talk was about about 5 minutes long, and the corresponding data showed no clear trend. Bush spoke for about 10 minutes, and there was a small positive trend that yielded a Chisquare of 634.61 on 600 df, with a p-value of 0.159.
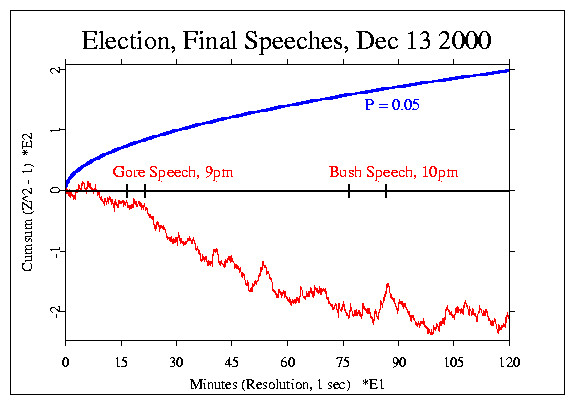
Elections 2000,
Dec 13, 20:30 to 21:30


GCP Home