Shuttle Columbia Disaster |
|
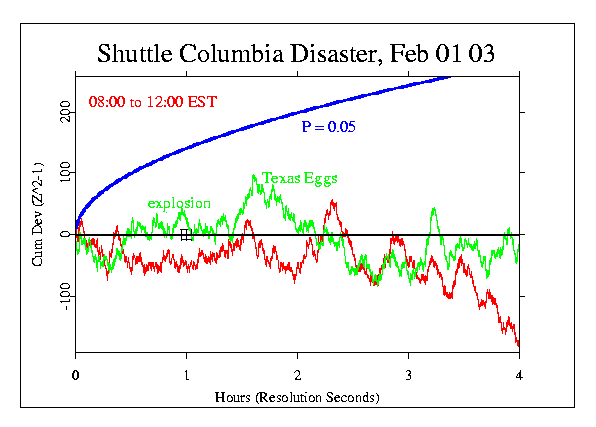
The Columbia shuttle disaster on Feb 1 2003, though most poignant to Americans, is arguably a global event. Some of the astronauts were from other countries; one was born in India and another was the first Israeli in space. People around the world feel sympathy and loss. The shuttle was scheduled to land in Florida at 0916 EST (1416 GMT), but a few minutes before 09:00 problems with wing sensors were reported, and at 09:00 the last communication was received. Within a few minutes, residents of north Texas reported loud "bangs", and vapor trails. The news was pretty immediate, and though people expressed hope, there was little, and then about 9:30 or so, NASA put the flags to half mast. The formal prediction period was set from 08:00 to noon, to include an hour of precursor time and three hours following the explosion for the news to spread. We also explore other timespans and related moments, and look at the device variance because so many people are interested to know what the GCP network did. There were data from 48 eggs at the end of the day and the begining of the 2nd. First, the formal analysis. It does not show a significant departure from expectation. There is a fairly steady trend in the negative direction, but the Chisquare is 14235 on 14400 df and its probablility is p = 0.834, equivalent to odds of 1 in 6. Three more eggs had reported as of the 3rd, including one of two eggs in Texas. Their addition did not materially affect the formal analysis, but it allows display of the response of these, the nearest eggs. Their composite is shown as the green data line in the following figure.
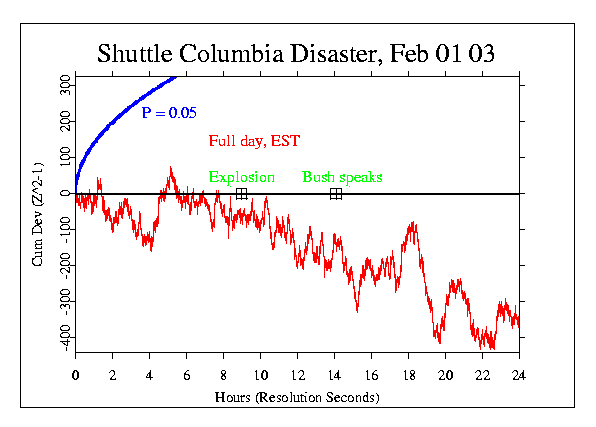
The larger context of the full day shows that the trend is persistent. Indeed, it continues for the rest of the 24 hour EST day with a consistent slope.
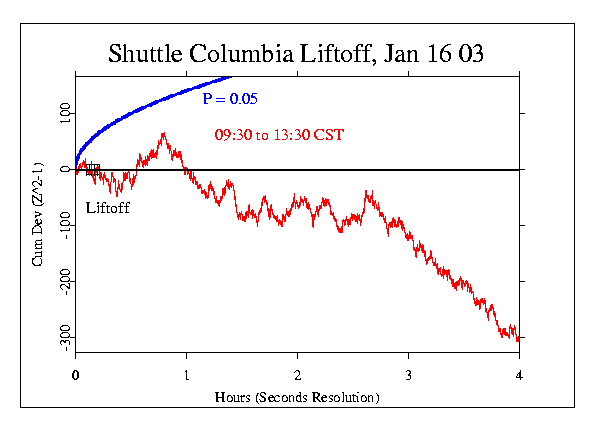
Some thoughtful correspondents wondered also if there might have been any sign of the impending disaster at the time of Columbia's liftoff on January 16, at 09:39 CST. In particular, was there a response to the damage done by a piece of debris hitting the left wing about 80 seconds after liftoff. The next graph explores this, showing a 4 hour period beginning at 09:30. No obvious message, but the data show a general downward trend somewhat like that on Feb 1st.
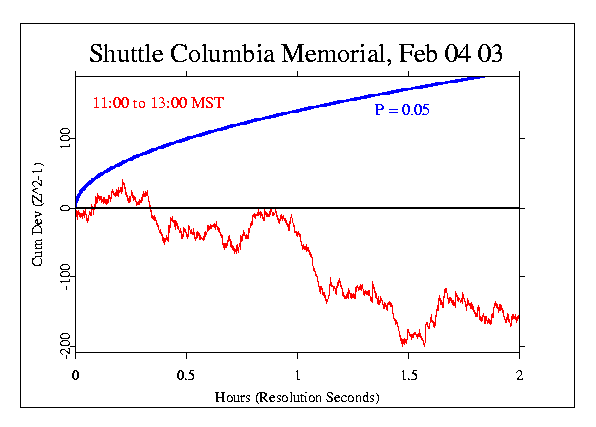
On the 4th of February, a major memorial service was held, with dignitaries including President Bush. A prediction was made by Bryan Williams for deviations during the ceremonies and for a time afterward. Specifically, he suggested 11:00 to 13:00 MST on the 4th (the ceremonies began at 11:10). While this is not a formal GCP prediction, the result is interesting. In terms of the trend it is very similar to the formal period following the explosion on the 1st, and also the period of the liftoff shown in the previous graph.
Bryan Williams did an analysis of the same time period using 15 minute blocks. Though the early part is similar, the data have a surge following the service. It is not significant, overall, with p = 0.33. Bryan also undertook a much more thorough exploration of the GCP response to the Columbia tragedy, culminating in a scholarly paper describing methods, results, and his own speculative interpretations.
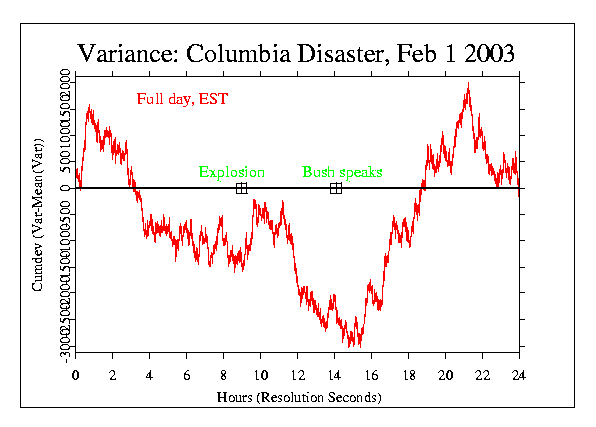
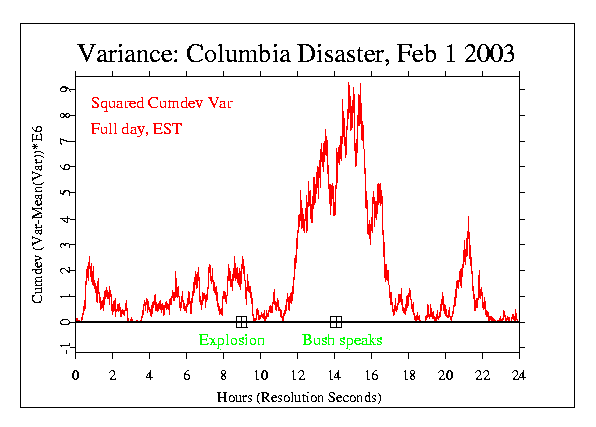
Looking at the cumulative deviation of the device variance from expectation gives another perspective. There is a suggestion of unusual activity around and after the explosion. The following figures show first, the pattern of the raw variance, and second, the same data squared. The first picture indicates a decrease in the variability among the eggs, especially about two hours after the explosion. The second figure displays the relative magnitude of departures from expectation, and it presents a picture that does seem to be aligned with the feelings many people have. But please be aware that this is not a scientific test -- it is an interpretive selection created by honing the display process, making it look more powerful than it likely is. In fact, approximately 34% of 10000 permutations of these data have a peak somewhere in the 24 hours that is as extreme or more so than the original data.
|
