|
The primary analyses for New Years 2002-2003 are complete as
of January 4th, 2003. All of the current array of active eggs have
reported as of this date, with 54 eggs archived on December 31 and 52 on
January 1.
The formal analyses are based on the fully detailed data, with
1-second resolution. Although a few eggs are not synchronized to the
second, their mis-synchronization has only a conservative influence, so
all eggs are included in the analyses.
The composite across timezones specified for the last two years
is used again. (The procedure for the composite is
signal averaging like that used to reveal non-random structure in brain
electrophysiology, for example, in examining evoked potentials.)
A simple picture of time differences around the world assumes 24
timezones, but the formal analysis is based on
37 official timezones, from -14 to +12 hours from GMT, including 10
zones with half-hour offsets.
-
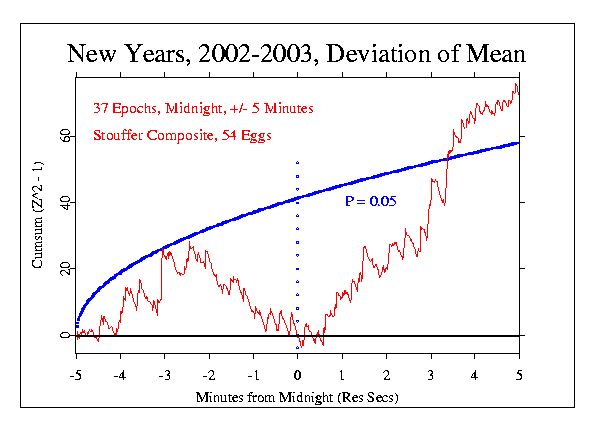
The 10 minute period surrounding midnight, which corresponds to
the first of the formal predictions, shows a significant positive trend,
with Chisquare = 679.75 on 600 df, p = 0.013.
[note: this is a corrected value with half-hour time zones integrated
correctly. Previous value was Chisquare = 672.25 on 600 df, p = 0.021.]
The following figure shows the data for the formal prediction graphically.
Most of the meanshift is
in the sharp positive incline beginning at about midnight and continuing
for the rest of the 10-minute period. Because of the low signal to
noise ratio, it is not scientifically useful to interpret the details of
such graphs, but it is tempting to imagine that the strong trend could
reflect the relaxed feeling of revelers who have just toasted the New
Year.

-
The second of the formal predictions for New Years 2001-2002 is based on
earlier years, beginning with the prediction of reduced variance near
midnight on Y2K.
To test it, the variance across eggs was normalized as Z-scores for each
second, then the sequence was smoothed and plotted.
The prediction for this event dithered about the question whether to use
Z or Z² but it seems (as was decided last year) that
the original Z more clearly represents the point of the prediction.
However, the decision was made to make this prediction a two-tailed, or
non-directional prediction of deviation. Thus,
either a reduction or increase in variance is considered, and the
treatment is equivalent to a Bonferonni adjustment factor of two
for multiple analysis.
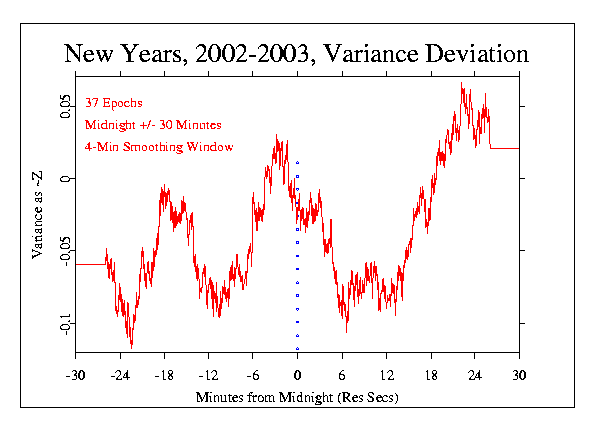
The sequence of Z-scores was
smoothed with a running mean (moving average) using
a four-minute window of 240 points, following the precedent of the
previous years. In contrast to the 1999-2000, 2000-2001,
and 2001-2002 analyses, there is no compelling evidence for an
alteration of the variance around midnight. In the present case,
the smoothed curve does not display a clear reduction (or increase)
of the variance around midnight. Instead, the largest deviations are
about 20 minutes before and after the hour.
The following
figure shows a one-hour period centered on the New Year celebration.
The red curve is the running mean (moving average) of the normalized variance.
The smoothing window is 4 minutes wide,
and was chosen to replicate the previous years' analyses.
An estimate for the likelihood of the apparent structure cannot readily
be made on the basis of theoretical expectations, so a permutation
procedure was used.
The original data represent a superimposition that
yields an average for each second across the 37 timezones (signal averaging).
The 60 minutes centered on midnight comprises 3600 datapoints.
To estimate the likelihood of the variance reduction at midnight,
the signal averaged data
were randomly permuted 10000 times. The figure shows the
original or "true" data in red.
There were 8300 cases in the distribution of random permutations
where the maximum deviation was closer to midnight
than in the original data, corresponding to
a probability of p = 0.83.
Another permutation analysis to estimate the frequency of this
degree of variance reduction at midnight found that
in 10000 cases, 75% had a larger deviation somewhere
in the hour long period surrounding midnight (p = 0.75).
When the measures of proxmity and degree are
combined, the resulting probability is 0.623, which is non-significant,
and indeed is slightly in the opposite direction from prediction.

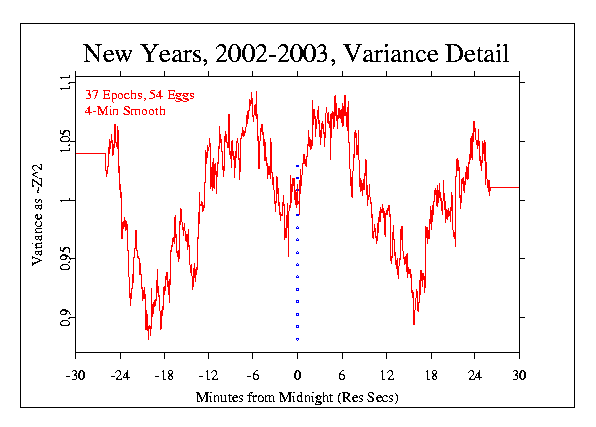
The Z-squared versions of the analysis were also graphed, and look a
little more like there might be structure associated with the midnight
moment. There is more obvious symmetry, and a distinctive pattern of
deviation just at midnight, but it is not very strong; there are other
deviations at about 15 or 20 minutes on either side that are more
prominent.

The feeling of exhuberence that seems nearly universal for the
New Year transition was likely damped by the continuing litany of
terrorist attacks and threats of war. The global economy seems
still to be reeling from the uncertainties that followed the
September 11 2001 attacks, and seems to reflect as well the
continuing troubles around the world.
Nevertheless, though the outcome of the GCP analyses is not hugely
impressive, one of the two pre-planned tests of the hypothesis does have
a significant result. In contrast to the previous years, where effects
were strongest in the variance data, this year
the Stouffer Z data show a substantial departure from expectation.
|