|
The hurricane season is presenting big storms again, and one of the most
dangerous is Katrina, which hit southern Florida and did considerable
damage, but then grew stronger in the Gulf of Mexico, where it reached
Category 5 while heading directly toward New Orleans.
Katrina weakened slightly before it crashed ashore around 6 a.m. on
August 29 2005 in southeastern Louisiana
as a Category 4 storm with winds topping 140 mph. By 11 a.m., winds had
fallen to 125 mph as it moved inland.
The damage and destruction at the time of this writing are still being
assessed, but it is clear that this is a disaster of major proportions.
Biloxi is devastated as if by war, and the center of New Orleans is
flooded and the waters are still rising.
We made a formal prediction, with the intention to add this event to
our standing category
of natural disasters. The formal specification was for
the period from 11 am GMT (which
corresponds to 6 am local time) to the end of the GMT day.
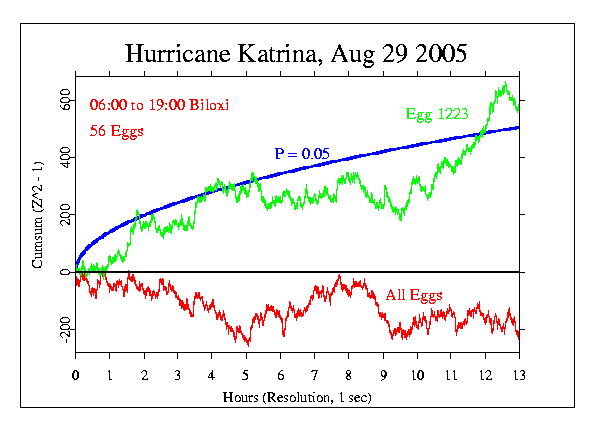
The result has Chisquare = 46575.9 on 46800 df, with p = 0.768 and
equivalent Z = -0.731. Visually, the trace shows a small negative
trend, but it is indistinguishable from a random walk.
To explore the effect on more local eggs, I pulled the data separately
for the Asheville egg, 1223. It is plotted separately in the first
figure. The impression is strikingly different from the composite of all
eggs, with a persistent, strong slope leading to a terminal value that
would be significant if formal.

But it is imperative to understand that the impressions
we get from individual analyses, especially if they are not formally
specified in a hypothesis test, are truly unreliable
for at least two important reasons. The first and most obvious is that
the signal to noise ratio is so low that any given single analysis is
a combination of a possble non-random signal and a random noise
background. The background may exhibit trends with no reason
and no regularity; the random noise may mask signal or may
masquerade as signal, and we have no way to discriminate these
possibilities -- except by patient repetition of our
question. In repeated measures, regularities will emerge through summing
consistent deviations over time, while mere noise will cancel.
The second possibility, less obvious, but nevertheless important, is
that we don't know what questions to ask, or how best to formulate them.
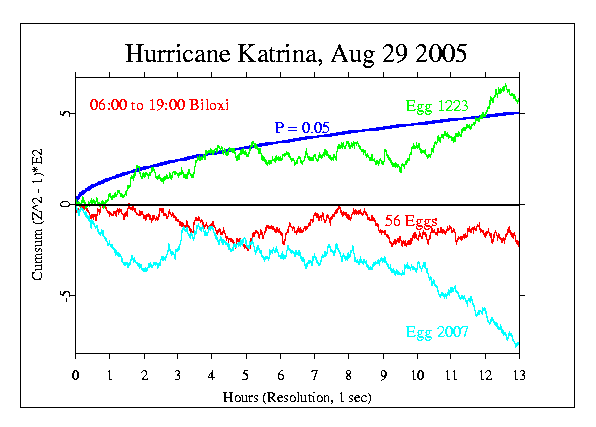
The following graph suggests that our prediction of a positive trend may
not be appropriate -- we have two individual traces that deviate at the
two sigma level (less than 5% expectation) but they have opposite signs.
That is, the results for Egg 1223 (Asheville, NC) and Egg 2007 (Juno
Beach, FL) are both extreme, but one shows an increase in the squared
Stouffer Z and the other an equally strong decrease.

Several days have passed, and the aftermath of Katrina is now understood
to be a horrendous catastrophe. The flooding of New Orleans has
devastated the city, with expectations that it will take months
to reclaim the low-lying parts, and much longer, years to rebuild and
recover the greatness of the past. The whole gulf coast is damaged
almost beyond comprehension, with Biloxi and Gulfport just piles of
rubbish from the coast to a mile inland. Comparisons have been made with
the Tsunami, and with the destructive force of an atomic bomb.
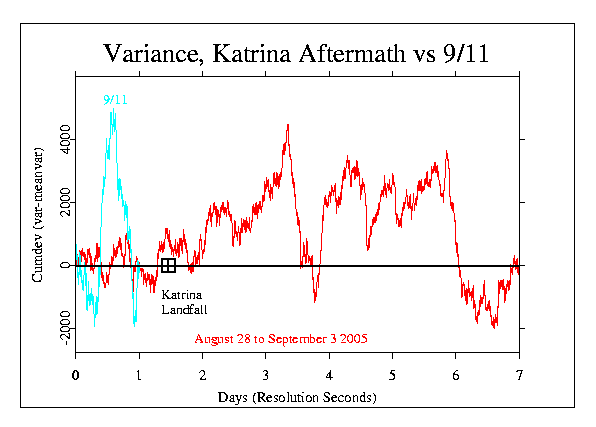
The variance of the GCP data over this period of time has extraordinary
excursions, reminiscent of the extreme spike on September 11 2001. The
following figure shows the cumulative deviation of the variance
over seven days beginning with August 28. The first landfall of Katrina,
on the 29th, is
marked. For comparison, the variance data from 9/11 are plotted in the
same format, superimposed on the first day of the sequence.

|