|
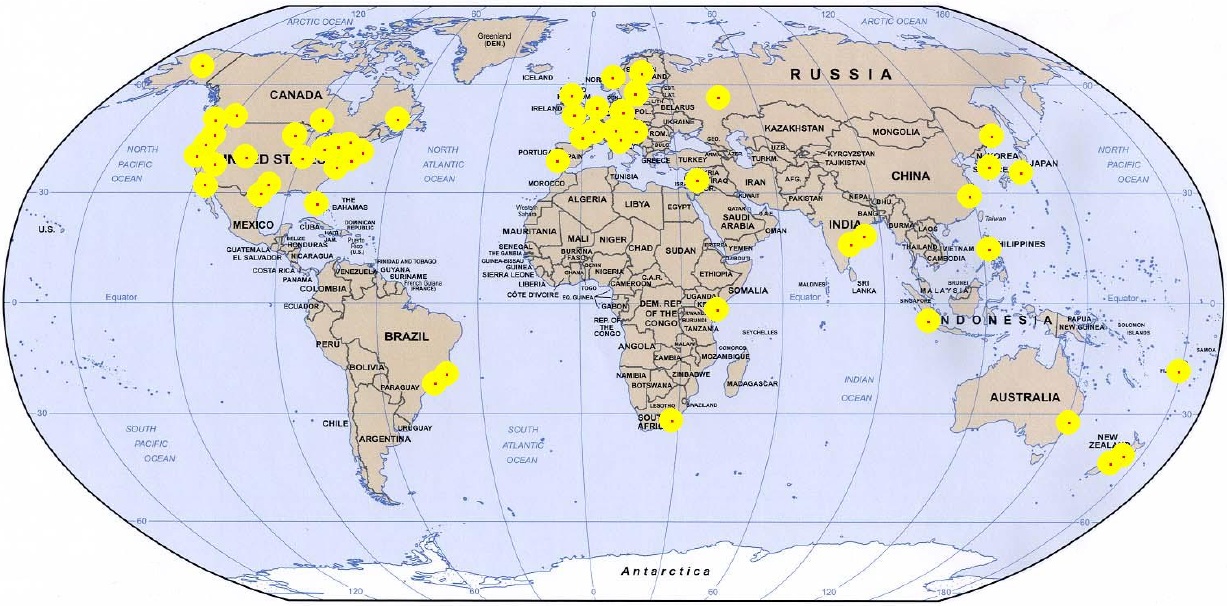
A GLOBAL NETWORK of random sources shows deviations linked with events that affect millions of people. The results challenge common ideas about the world, but independent analyses confirm the unexpected behavior, and also indicate that it cannot be attributed to ordinary physical forces or electromagnetic fields. The Global Consciousness Project (GCP) is an international collaboration created in 1998 to study the subtle reach of human consciousness in the physical world. We maintain a network of random event generators (REGs) with nodes in more than 50 locations, from Alaska to Fiji, on all continents, and in nearly every time zone. The world map on the right has a bright spot for each of the host sites. |
|
|||||||||||||||||||||||||||||||||||||||||||||||||||||
|
GATHERING DATA
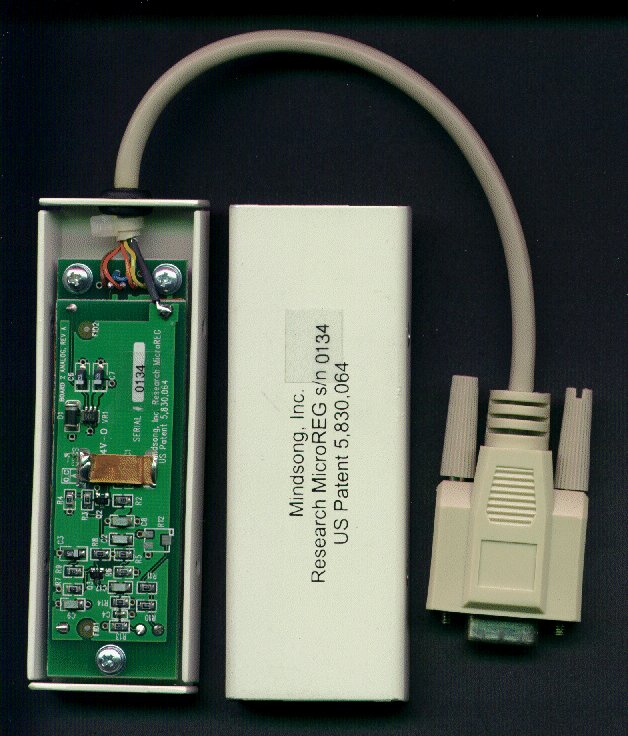
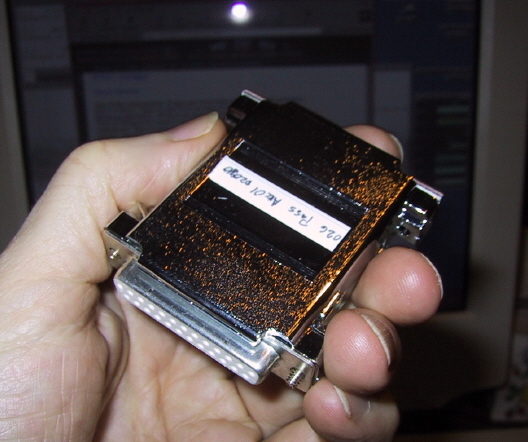
Every second, each REG produces
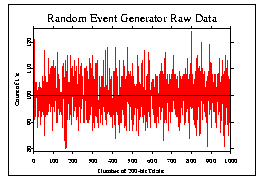
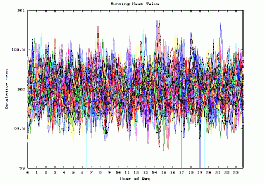
The figures below show plots of the raw data:
|
|
|
|
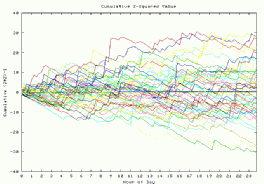
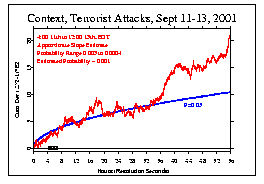
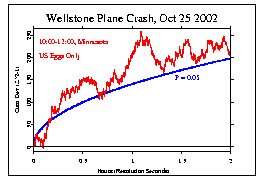
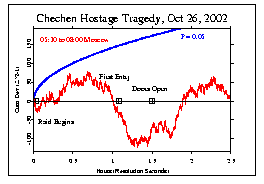
PLOTTING RESULTS The continuous datastreams from these instruments tend to depart from expectation when major "Global Events" stimulate a wide-spread coherence of thoughts and emotions. Three samples below show the composite or average of the cumulative deviation traces from data collected during such events. Random data generally wanders around the horizontal line at zero, while a consistent deviation resulting in a sloping trend indicates that something changed the output of our instruments.
|
|
|
|
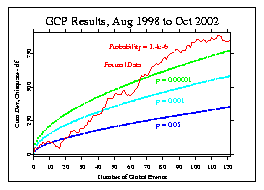
THE BOTTOM LINE The table on the right gives a sampling of results from the database of 122 events for which formal predictions were made over the past four years. The overall odds are about one in a million that we are seeing just chance fluctuations.
|
|
|||||||||||||||||||||||||||||||||||||||||||||||||
|
The trend (red line) should be horizontal for random data, but the positive slope indicates that something has affected the EGG network. The effect is small but reliable, so the outcome is highly significant. We don't yet know how to explain the subtle correlations between events of importance to humans and the GCP data, but they are quite clear. The results are evidence that the physical world and our mental world of information and meaning are linked in ways that we don't yet understand. |