Anniversary of 911 |
|
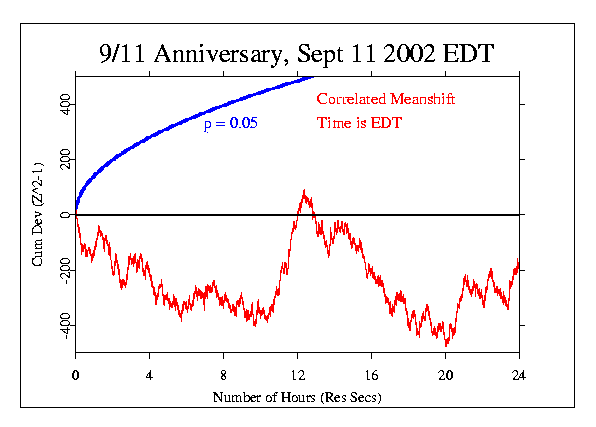
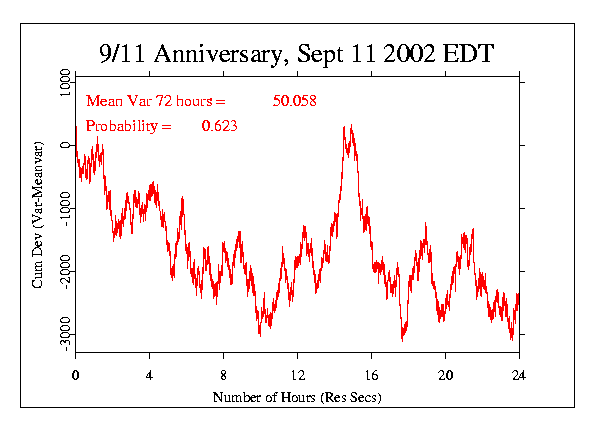
The one-year anniversary of the attacks on the World Trade Center and the Pentagon was an occasion for commemorations, and many people wondered if this day would show effects on the GCP network. We made two formal predictions, based on suggestions by correspondents. The primary results do not show the stark trends we saw in 2001, and for the formal analysis, the results are non-significant. The correlated meanshift (standard analysis) has a probability of 0.6818, and the device variance outcome has a probability (1000 iterations) of 0.623. The figures below show these two analyses, followed by some explorations that provide interpretive context. Here are some extracts from the prediction registry: On Thu, 21 Mar 2002, Eckhard Etzold wrote, in part:
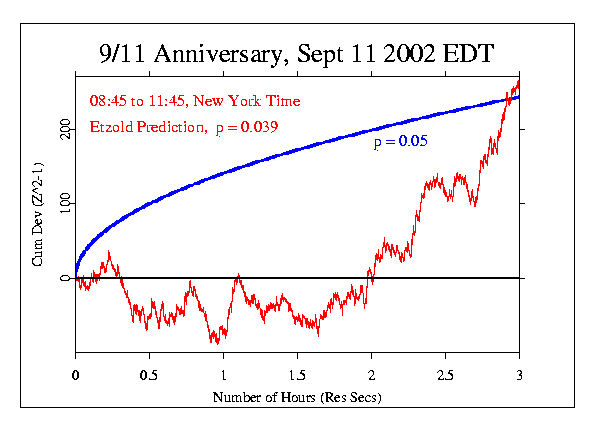
This prediction was accepted, with the caveat that we would look at the full network of eggs for the formal test. The following figure shows the result, which is marginally significant with Chisquare 11060 on 10800 df and p = 0.039. It is worth noting that the shape of this curve -- flat during the period of time when the actual attacks occurred, and then rising steeply -- is reminiscent of the graph showing the corresponding analysis for Sept 11 2001.
Gloria Mitchell sent an email on 15 Aug 2002 asking, "Are you going to monitor the effects of an event called the 'Rolling Requiem' which has been organized by the Seattle Symphony Chorale? To date 18 countries and 27 states will have chorals performing the Mozart Requiem on September 11. Most will be beginning at 8:46 a.m. in their time zone, hence the Rolling Requiem. In Olympia, because of the desire to have as much participation as possible, we will be conducting this remembrance concert in the evening at 7:46 p.m." This suggestion makes a nice format for a prediction, and given the apparent publicity, might be a "global event" in its own right. I decided to use the suggestion as the basis for a formal prediction, assuming that the Rolling Requiem will continue with a kind of ceremonial attention or actual concert for a period of time similar to that of the terrorist attacks, about 1.5 hours. For the analysis, because the Rolling Requiem periods will overlap, I decided to do the simple, standard analysis of the full 24-hour day.
The last formal prediction focused on a device variance analysis, duplicating that for 2001. This is a cumulative deviation of the variance, with permutation analysis to determine the probability of the maximum absolute excursion during the day. The empirical variance for three days was used as the expectation value, since this analysis is sensitive to the difference of the REG behavior from theoretical expectation.
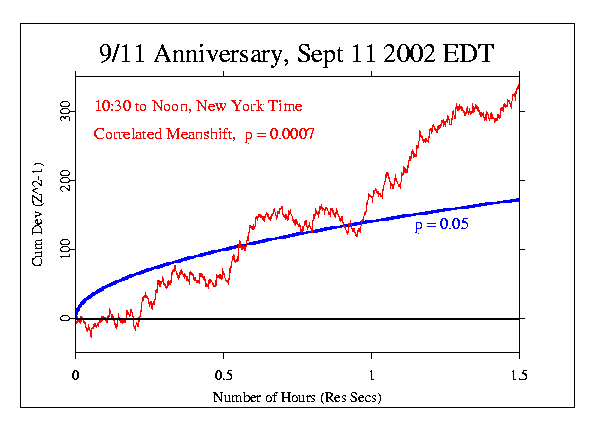
Both of the preceding graphs have some suggestive features. The period from about 10:30 to noon, just following the time of the attacks and the destruction of the World Trade Center towers, shows a striking trend in the first graph, which displays the correlated meanshift. The next figure displays that segment by itself. Of course this is selected by looking at the day-long graph, and it is therefore not a meaningful analysis, statistically.
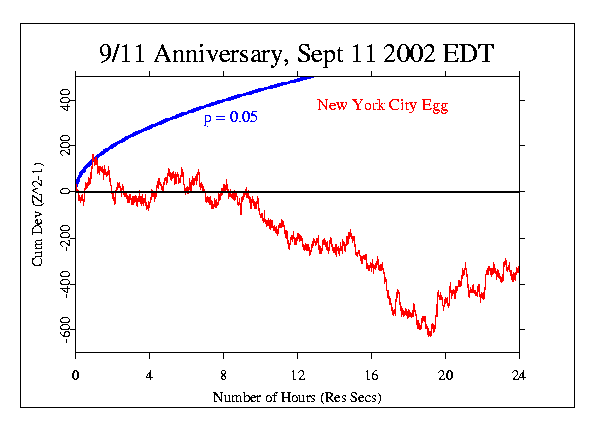
We might ask if the eggs nearest the major tragedies would react more strongly. The next figure shows the egg that is in New York City. Again, this informal exploration does not have a statistical value in our analysis, but the figure is interesting. The data show a long, persistent trend to low values all day until about 10 pm.
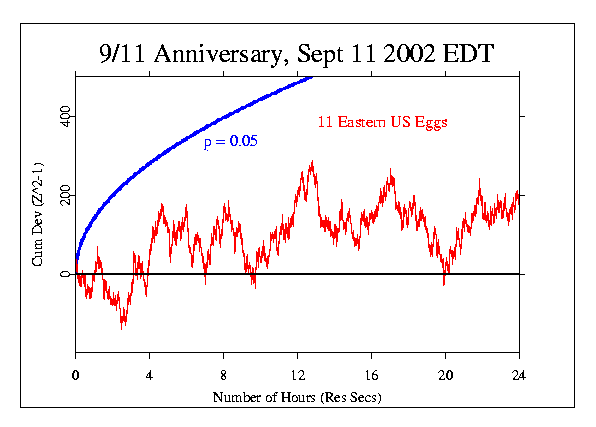
And we can ask what the result is like if we look at data only from the eastern part of the US. The next figure shows this and can be compared with the first graph above.
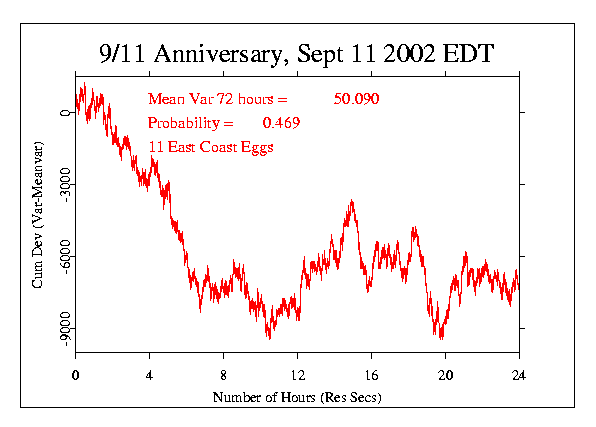
Finally, the next figure is for the eastern US eggs in the device variance analysis, and can be compared to the second figure above.
|
